
What's Under the Hood?
Engine Score: recent findings, leaderboards, benchmarks, and where to find yours...


We’ve got a lot of good info coming at you. Whether you’re a high school player (or parent) that’s in the thick of the summer and recruiting, or a youth player (or parent) waiting in the wings, keep reading. We’ve got exciting news about a positive correlation between Engine Score and level of college commitment from an analysis of our 2025 class; a refresher on Engine Score and age benchmarks for key performance metrics; top Engine Scores from 2025 high school evaluations; and info on where to find your Engine Score.
Correlation to College Commitment
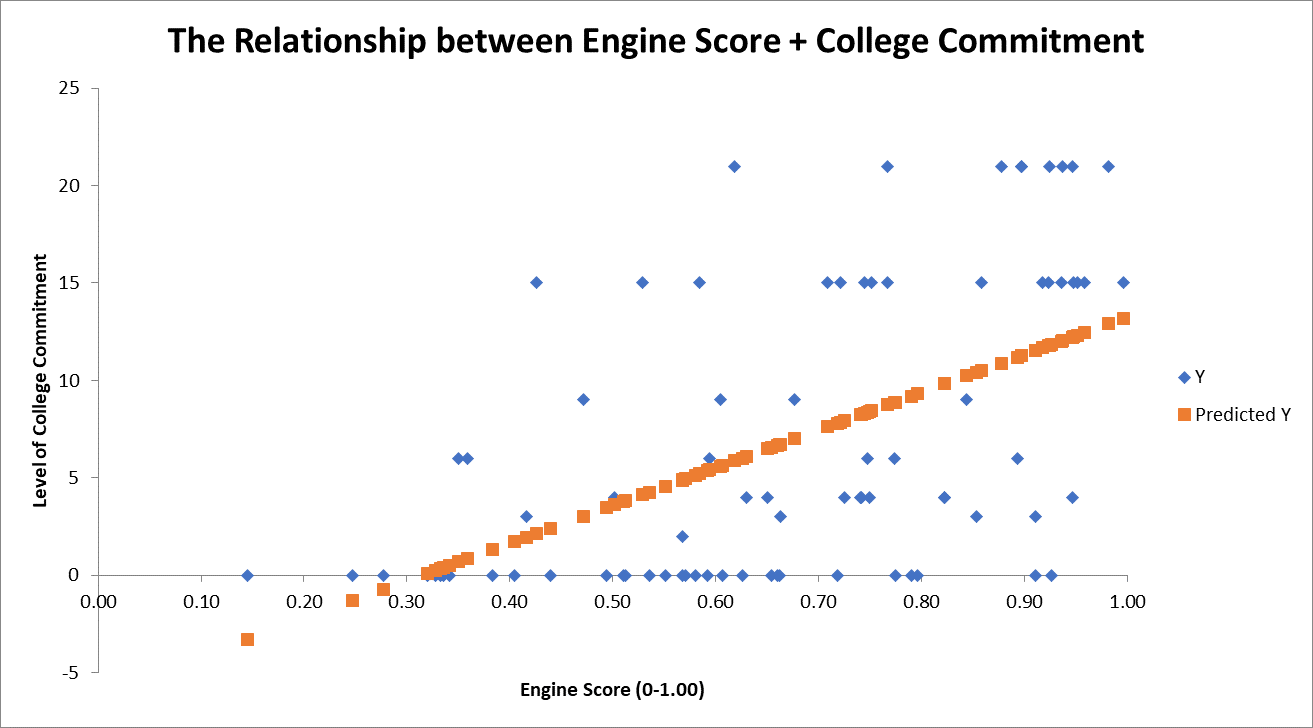
We recently ran an analysis between Engine Score and level of college commitment. We found a positive correlation between Engine Score and level of college commitment without considering any actual game performance.
If you’re interested in the guts of the analysis:
Looking at a sample of 81 rising senior players with an Engine Score in the 2025 class, there is a correlation coefficient of .54 between Engine Score and level of college commitment. This is a moderately positive correlation. Consider that points were assigned for different levels of college competition: D1 Power 4, 7; D1, 5; D2, 3; Juco/NAIA, 2; and D3, 1. A multiplier was then applied to adjust the point totals based on whether the player was a part of the 1st, 2nd, or 3rd team at the age level. Example: a non-Power 4, D1 commit on the top team for his age group would receive a point total of 5 times 3 = 15. See below for a line of best fit from the analysis.
Refresher: What is an Engine Score?
At Slammers, we measure progress across a number of key indicators in what we’re trying to improve in the physical profile of each athlete - knowing that the physical profile directly impacts what happens on the baseball field. The Engine Score helps take this to another level.
While the Loden Score alone is a strong indicator for throwing velocity and exit velocity, the Engine Score is a bit more specific to rotational athletes as it combines both the jump power metric from the Loden Sports Rebound Jumps test with how an athlete performs on their rotational med ball throw (from their dominant side). The Engine Score metric gives an even stronger signal for expected velocity performance on-field for baseball (and softball) players. It’s almost a perfect correlation.
What is an average Engine Score for my age?
Glad you asked. With over 100 Slammers continuing their baseball careers beyond high school in the last two classes alone, we have a really good idea of key metric thresholds for different levels of college competition. Take a look at Metric + Stat Benchmarks for Aspiring College Baseball Players to see generally what it takes to appeal to each level of college baseball. Remember, the more boxes you check, the better your chances. Engine Score is a critical box.
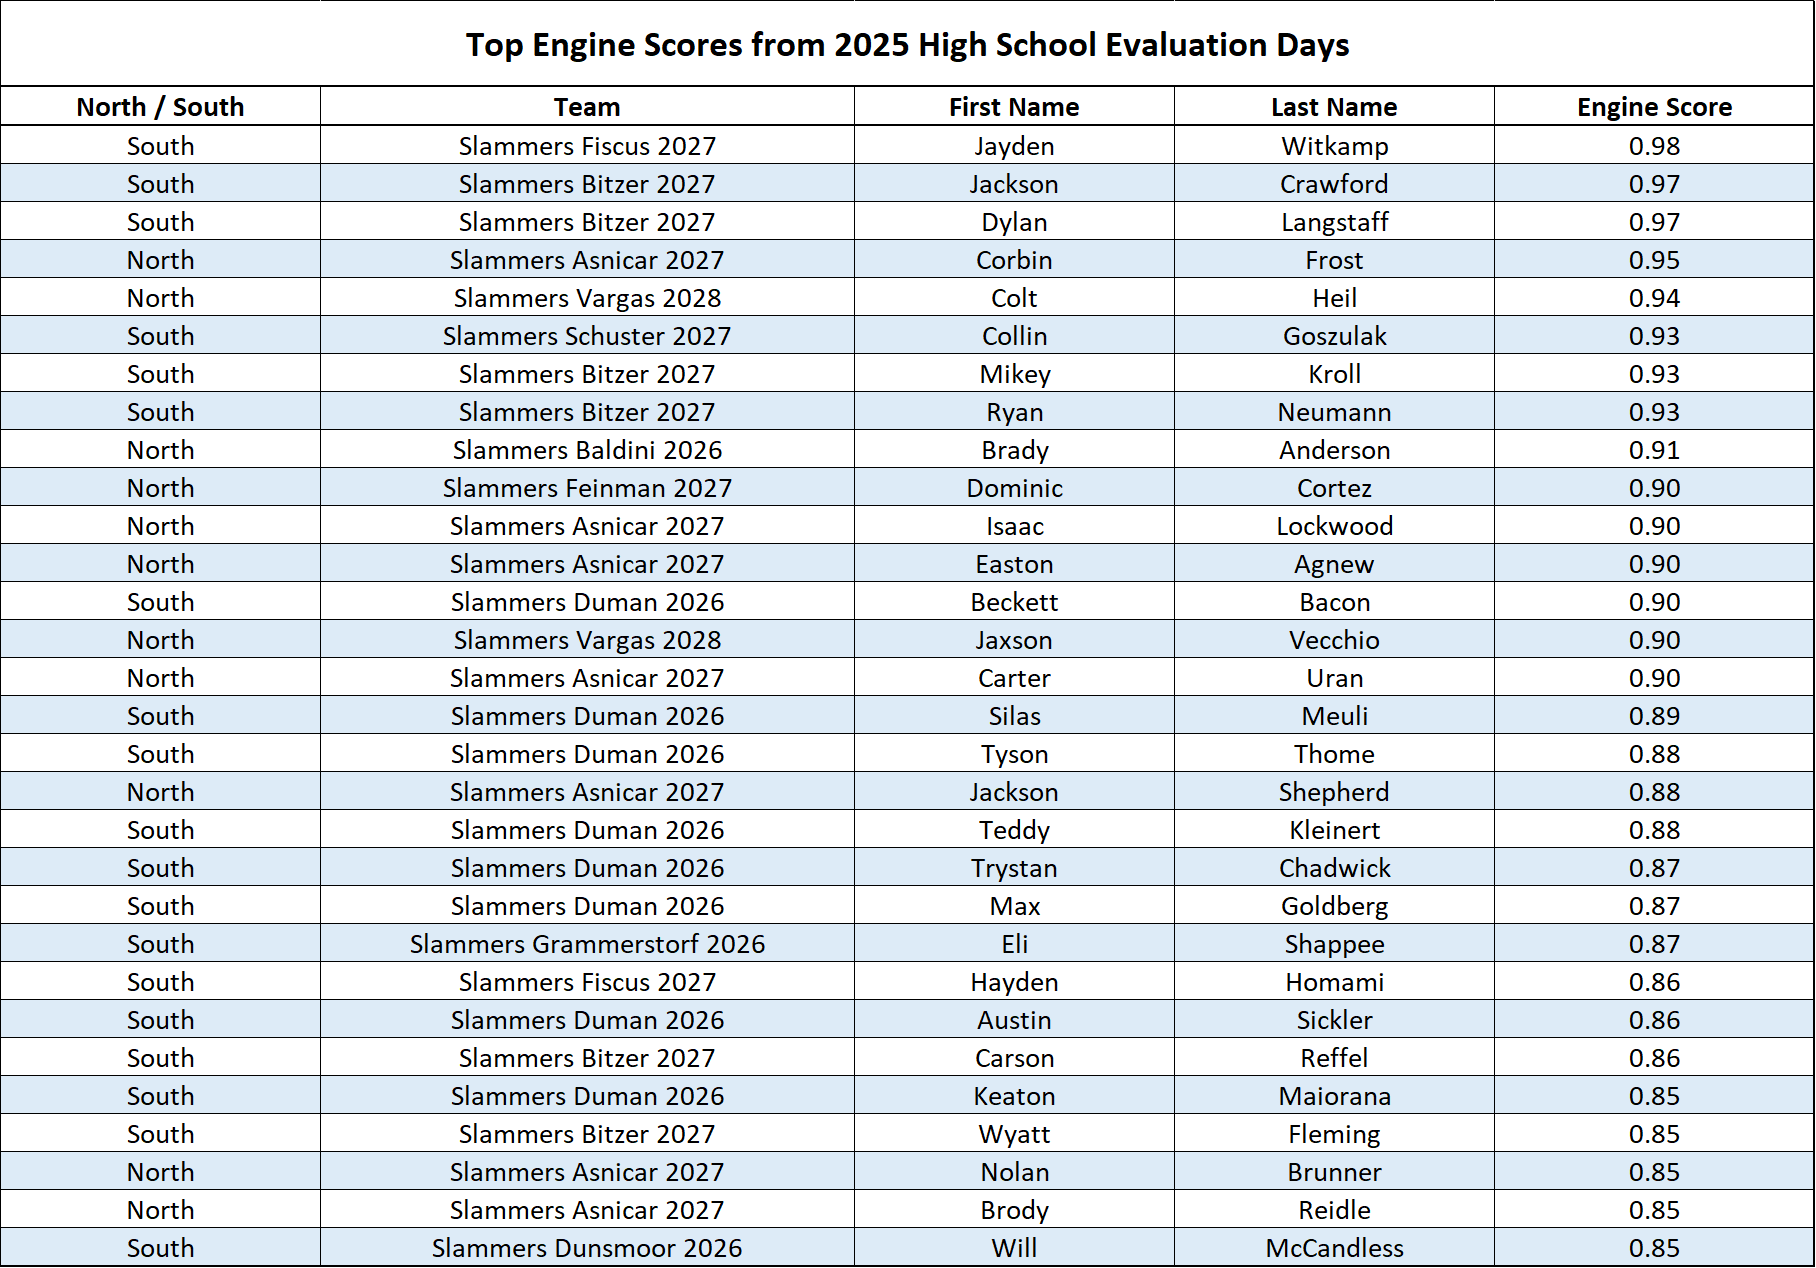
Top Engine Scores from High School Evaluation Days 2025
Let’s cut the bread in a few different ways. Check out the Top 30 Engine Scores from high school evaluation days across all classes:
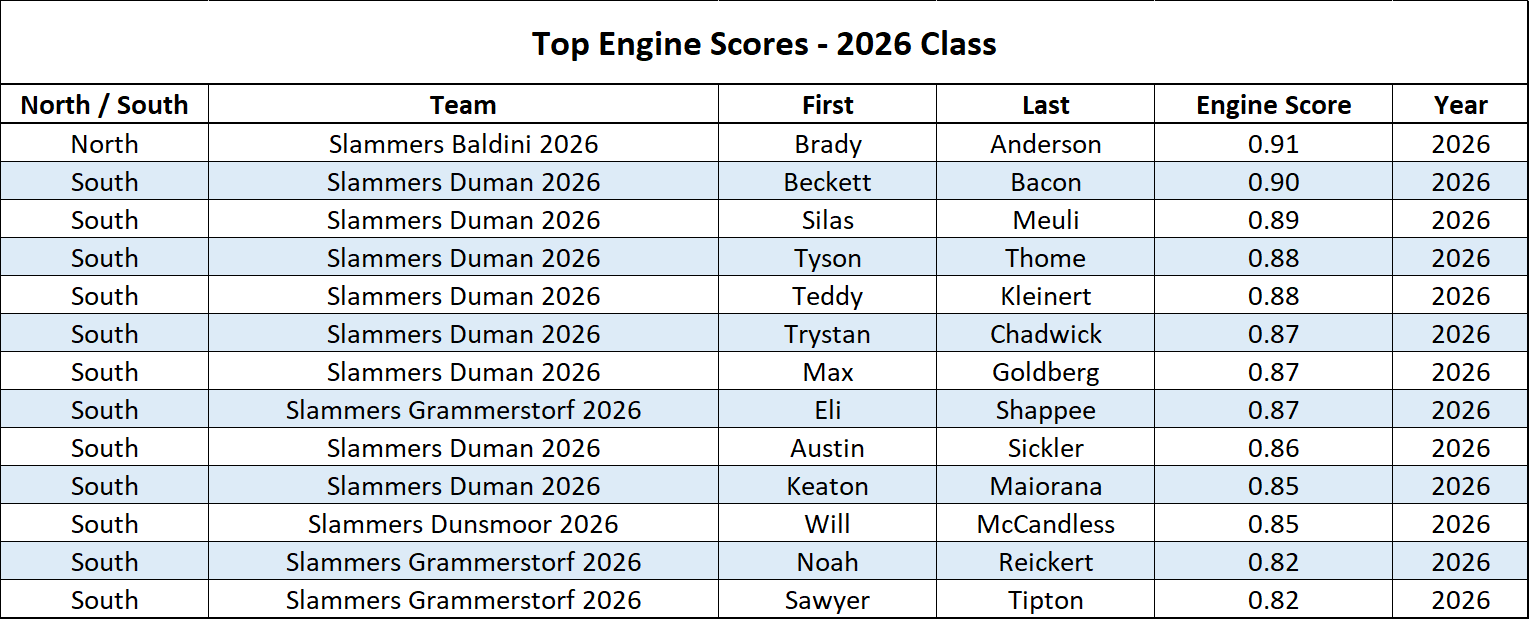
Top Engine Scores 2026 Class
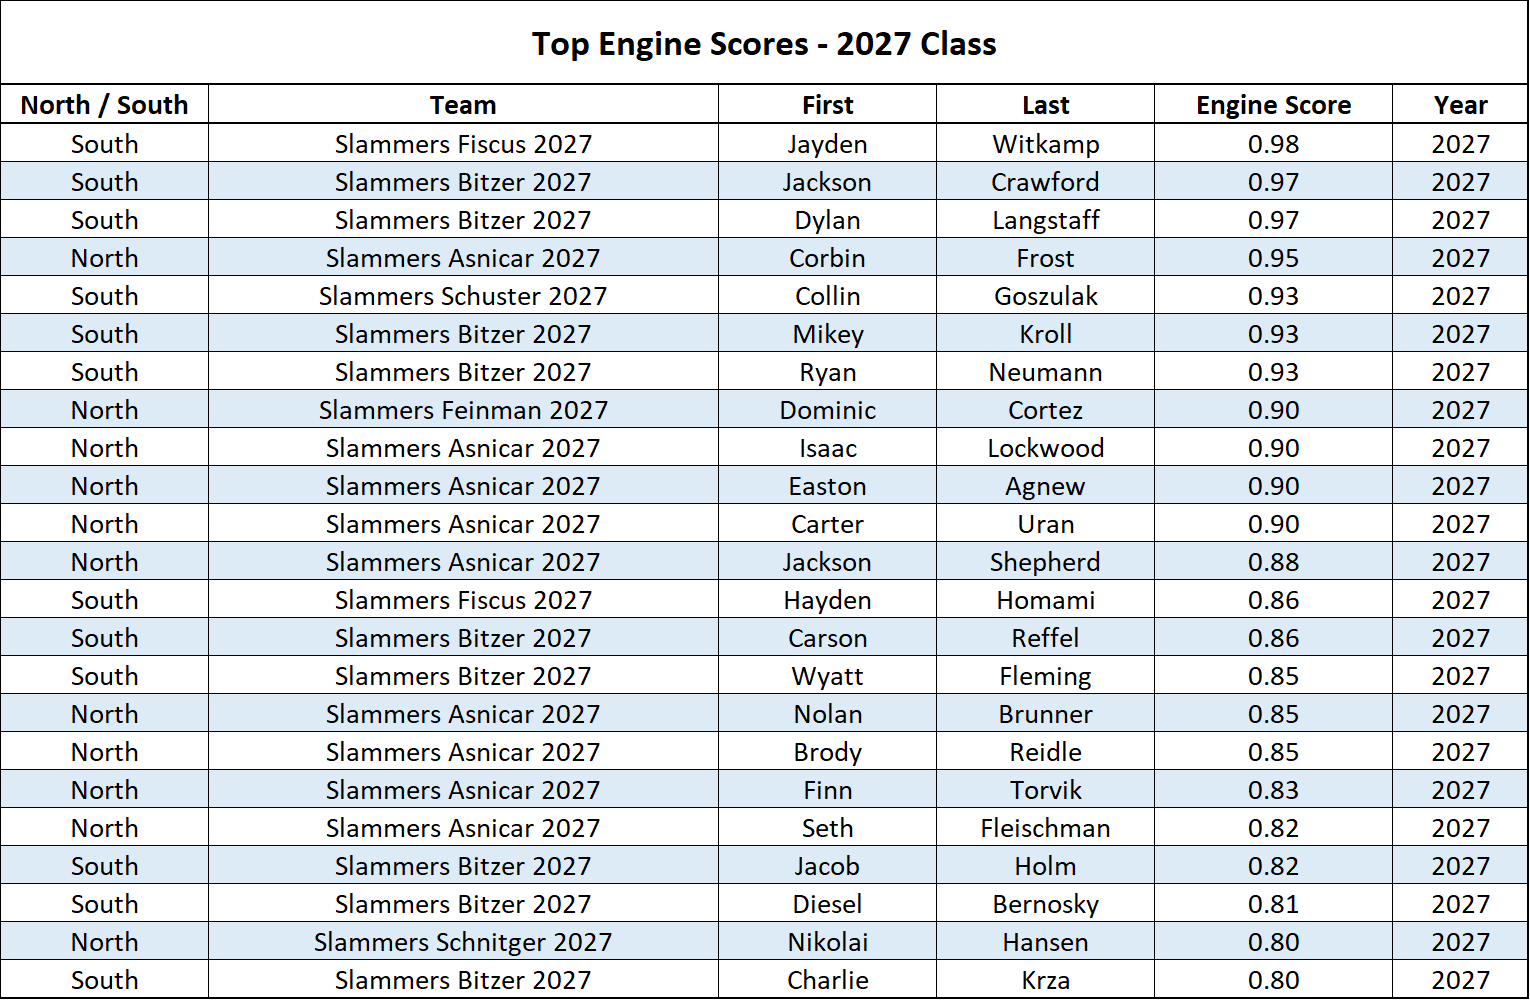
Top Engine Scores 2027 Class
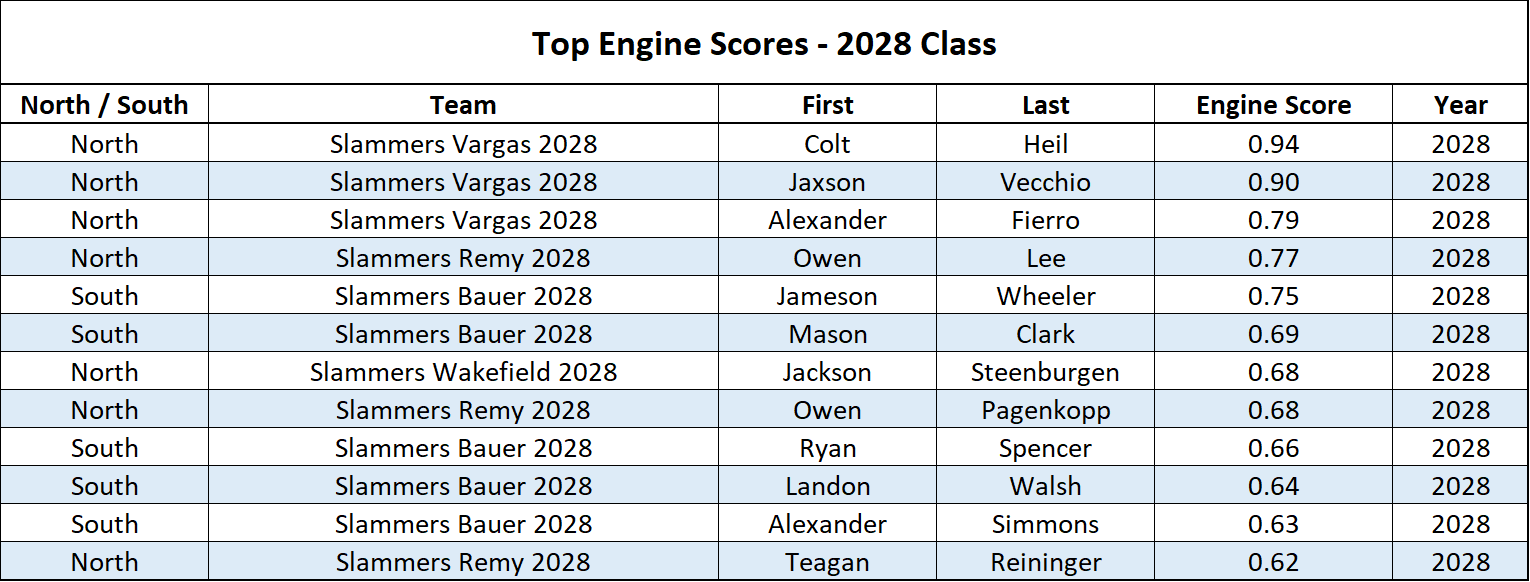
Top Engine Scores 2028 Class
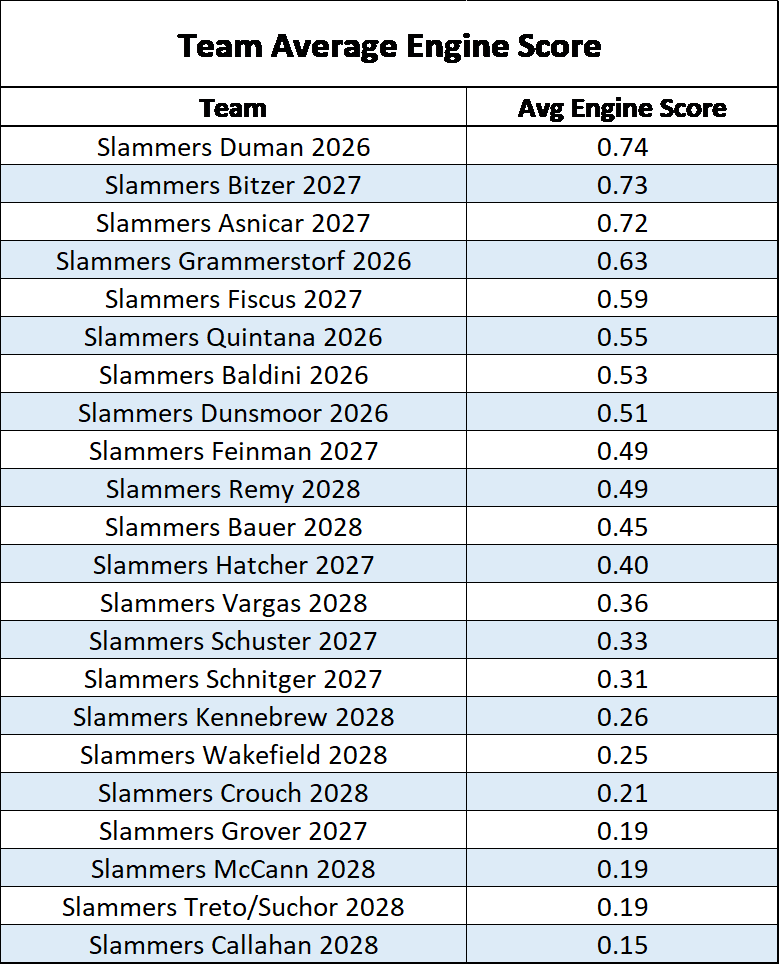
Team Average Engine Score
Where do I find mine?
All hitting and athletic data from high school evaluation days (Rapsodo and Loden) are in the Slammers Dashboard and all players should be able to access their profiles to view their Engine Score. We’ve had a slight delay getting the pitching data uploaded into profiles, but it’s coming…
If you haven’t logged in before, you should be able to use the email address that received this blog to reset your password. If you are unable to log-in through the web, please shoot me an email: mpajak@slammersbaseball.com.
Once you have reset your password through the web, you can use the same username and password to log into the Slammers App on your phone – available now in the iOS App and Google Play Stores – search: Slammers Baseball.